When I started working with SharePoint and wanted to debug a WebPart that I was developing, I used to attach the visual studio instance to all the “w3wp.exe” processes running in the server. In this post I will show an easy way to attach Visual Studio to the process that is running the web application you are working on and not all the “w3wp.exe” process.
I will show you how to create a Visual Studio external tool that will list all the running worker processes in the server with their respective IDs, this way you can identify which process to attach to the visual studio instance.
To create the external process, follow these steps:
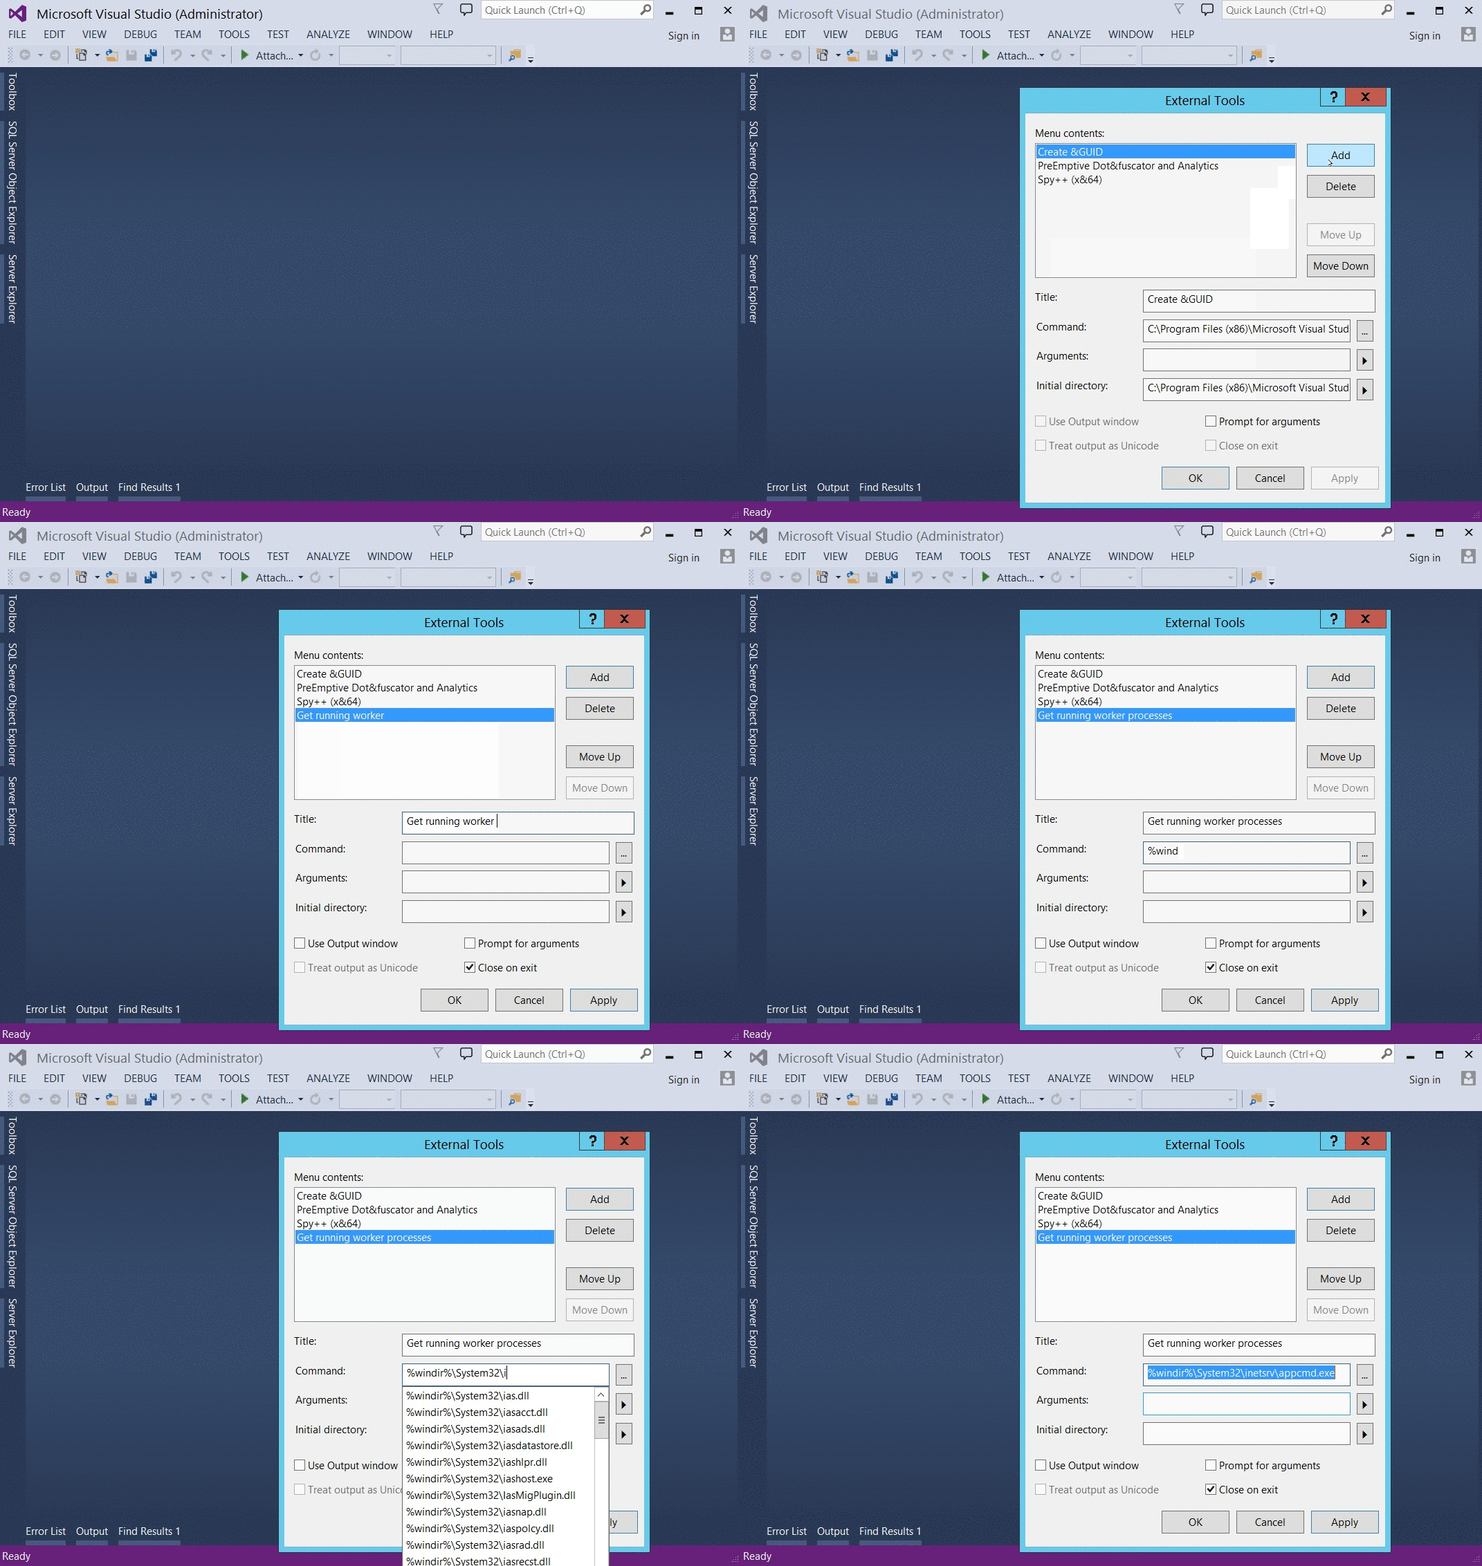
- In visual studio, go to Tools > External Tools…
- In the external tool window, click on the “Add” button.
- Set the tittle of the new external tool.
- In the command text box, write
%windir%\\System32\\inetsrv\\appcmd.exe. - In the arguments text box, write
list wp. - Check the “Use output window” check box.
- Save the changes.

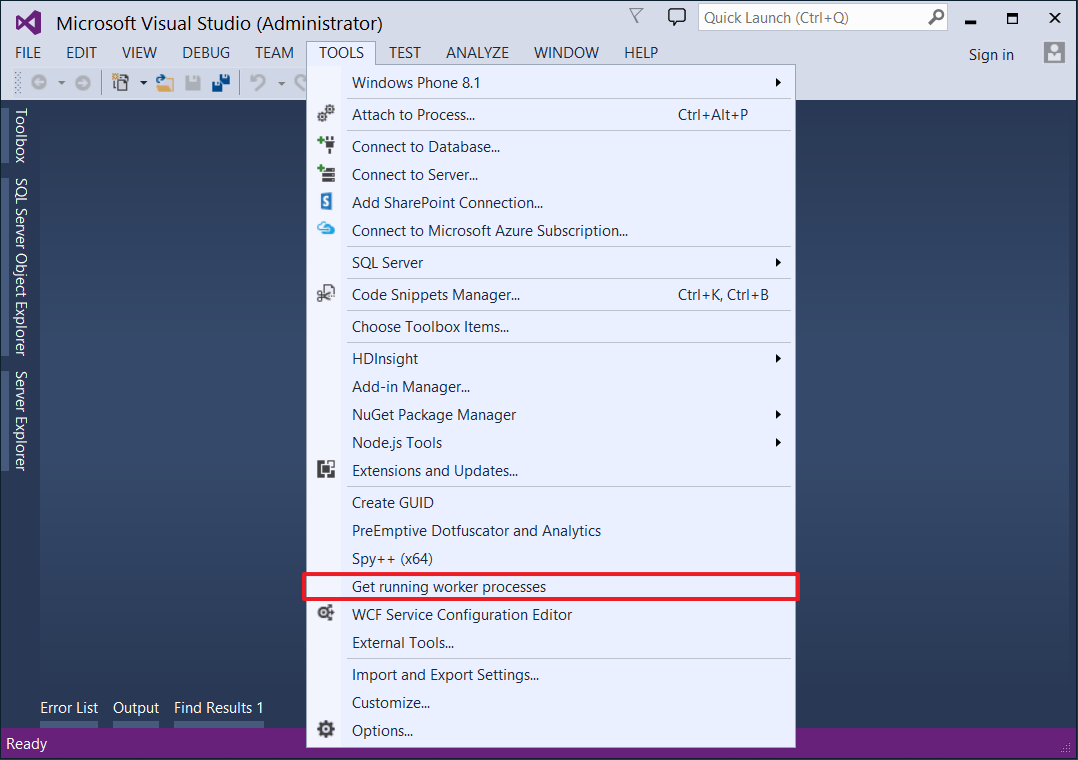
Once the new external tool has been created you should be able to see it on the tool menu with the name you specified.

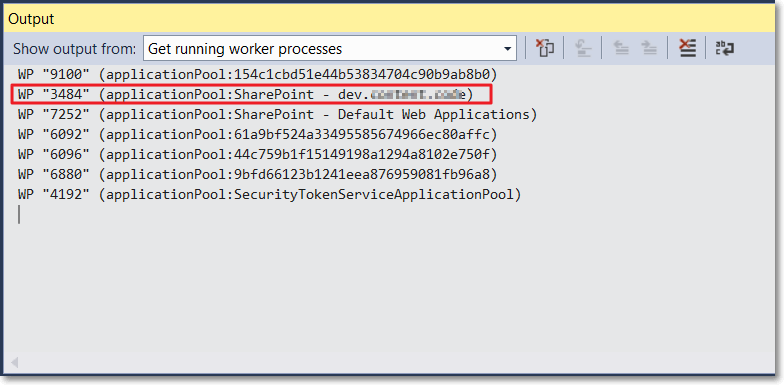
After clicking over the new menu option, the visual output window will show all the processes listed like the image below.

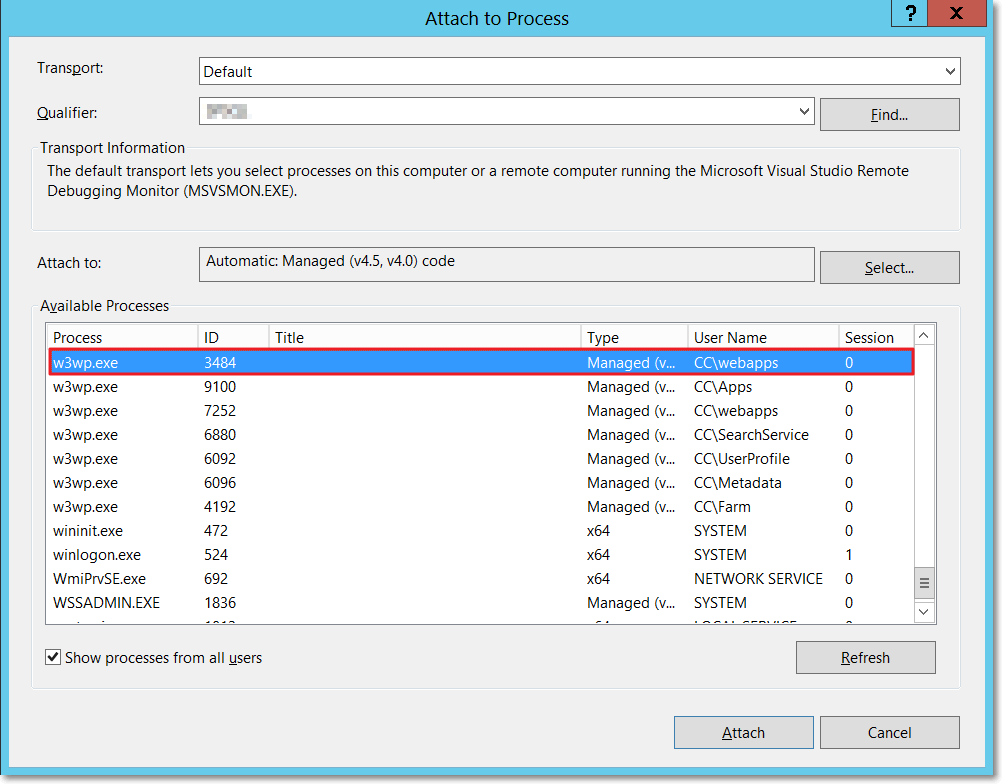
In this case, I was working with the web application of ID 3484. Now that you have this information, just look for the process with the matching ID and attach visual studio to it.

And that’s it! A cleaner way to debug a SharePoint on-premise solutions.
Hope you like it and find it useful.